procinsh - Looking Inside Linux Like Ghost in the Shell
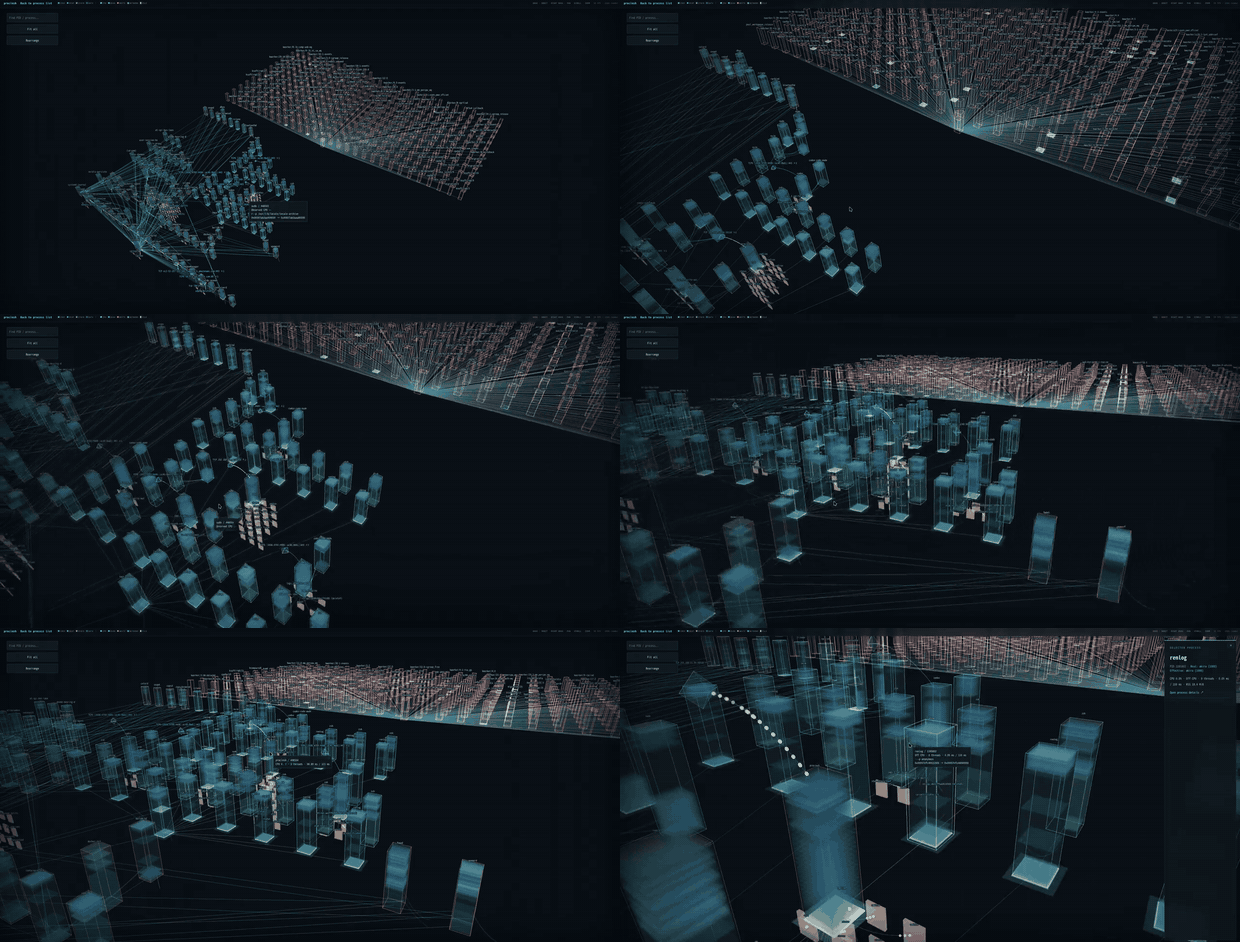
Do you like Ghost in the Shell? Recently, a new anime series has also been broadcast. Ghost in the Shell has been made into animation many times, but my favorite is the 1995 anime film.
Of the many things I like about Ghost in the Shell, my favorite is its depiction of cyberspace. There is something fascinating about seeing various circular objects floating in a 3D space. For a long time, I have wondered what each of those objects would correspond to on a real computer.
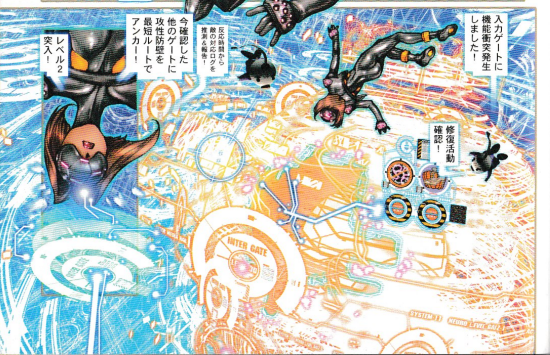
Source: Masamune Shirow, Ghost in the Shell 2: MANMACHINE INTERFACE, Kodansha, first edition published June 28, 2001.
I usually live in tmux + zsh + vim, and when I want to see what is happening across the whole system, I use tools such as dmesg, htop, and dstat. However, I have long wanted to interact with computers through an interface like the ones in Ghost in the Shell. So, I implemented such an interface.
A Practical Implementation Approach
Even if I want an interface like the ones in Ghost in the Shell, I am still a flesh-and-blood human without a cyberbrain. And I wanted it to be an interface that was actually useful in my daily work. So rather than reproducing what appears in Ghost in the Shell exactly as it is, I chose the following two implementation goals.
The first was to make it a cyberpunk user interface like Ghost in the Shell. More specifically, I wanted it to be displayed in 3D and to glow in real time in response to activity on the computer. I also placed importance on being able to move freely through the 3D space.
The second was to display meaningful information that reflects what is actually happening on the computer. Rather than making it just a cool-looking 3D graphic, I wanted it to be something I could use as a tool for work. I mainly use Linux at work, so I wanted to visualize Linux inside beautifully while also providing an overview of system-wide information that is difficult to get from existing command-line tools.
procinsh
What I built is procinsh. There is a demo video at procinsh demo. I replaced “Ghost” in the English title “Ghost in the Shell” with “Process”, then shortened “Process in the Shell” to procinsh.
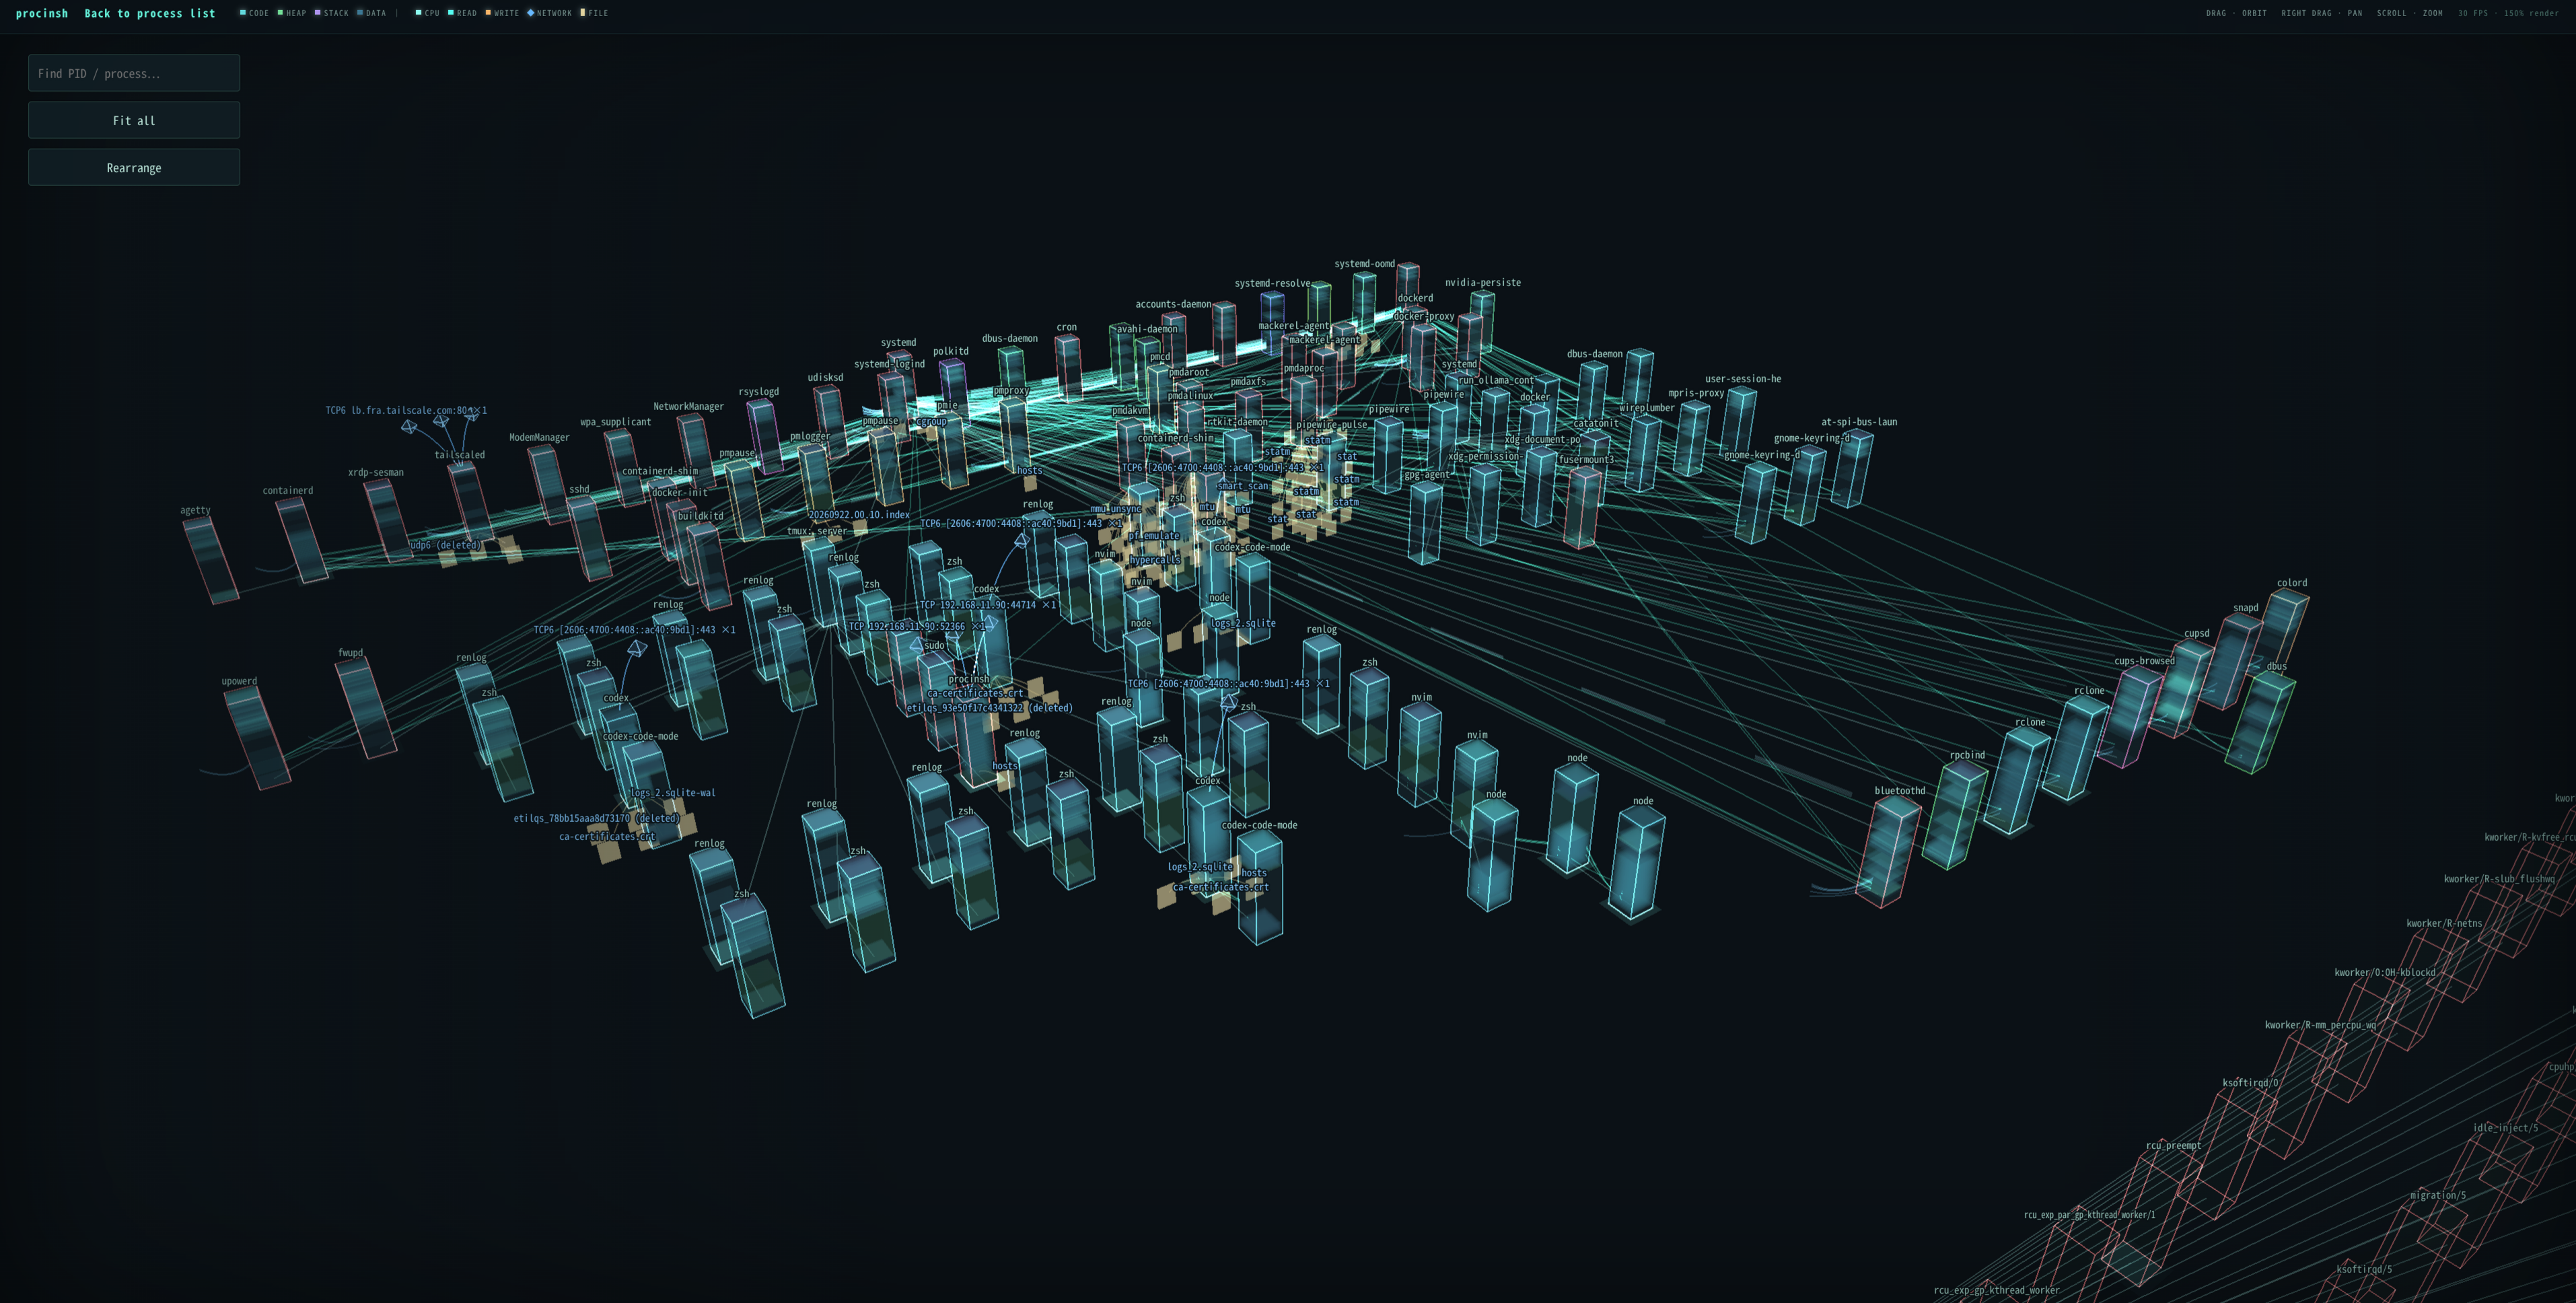
procinsh runs on Linux and monitors all processes on the host. Processes are rendered as rectangular boxes, and the bottom surface of an active process glows when they run on CPUs. Lines connecting processes correspond to things such as Unix domain sockets, and a white sphere moves along the line when data is sent or received.
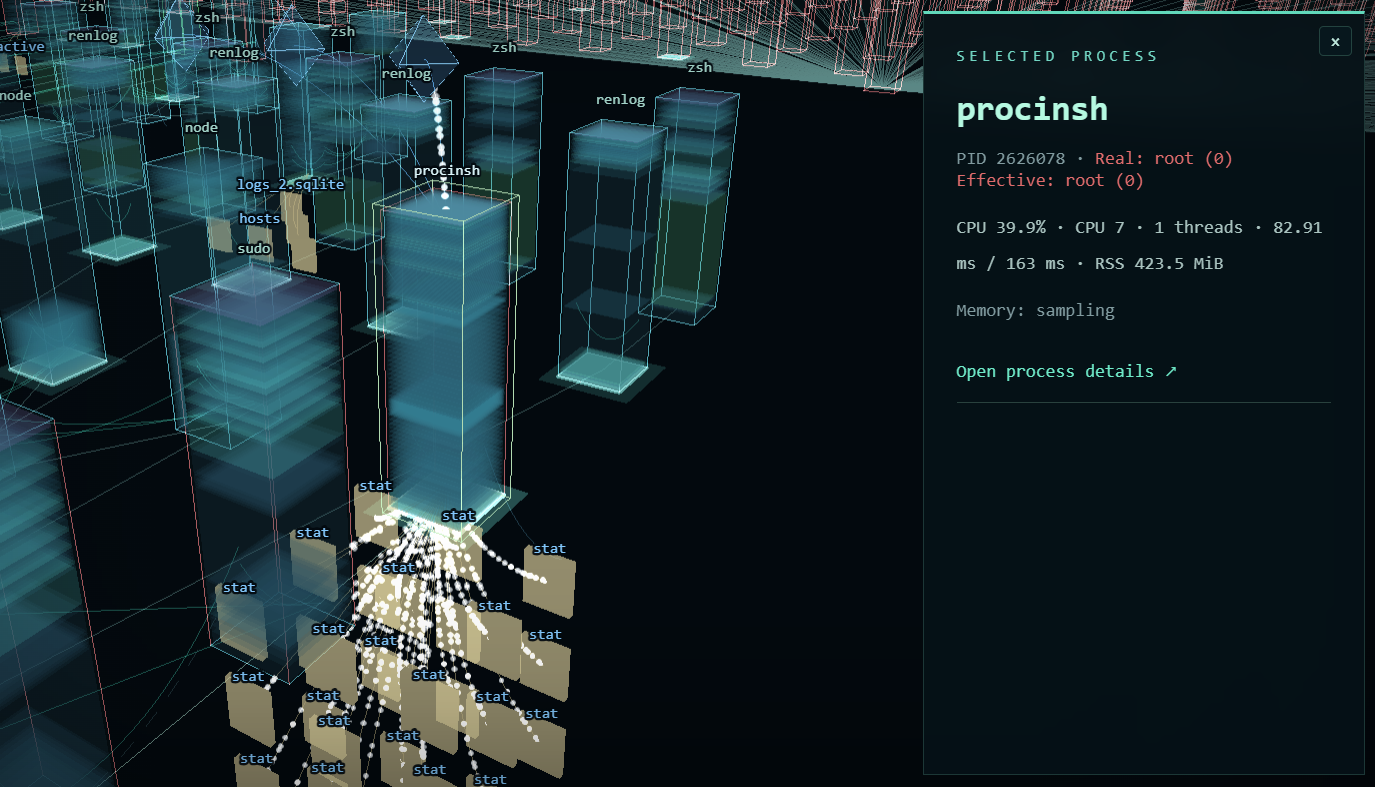
The z-axis of each box corresponds to the address space of that process.
The regions displayed inside the box correspond to regions actually mapped into the process’s virtual address space (/proc/<PID>/maps), and their names are shown when you hover the mouse over them.
For example, you can visually see where shared libraries are loaded in the address space.
When a process is reading from or writing to a file, the corresponding file is displayed below it. When it communicates with the outside world through a socket, the IP address (or domain) is displayed above it. In both cases, a white sphere is displayed while data is actually flowing.
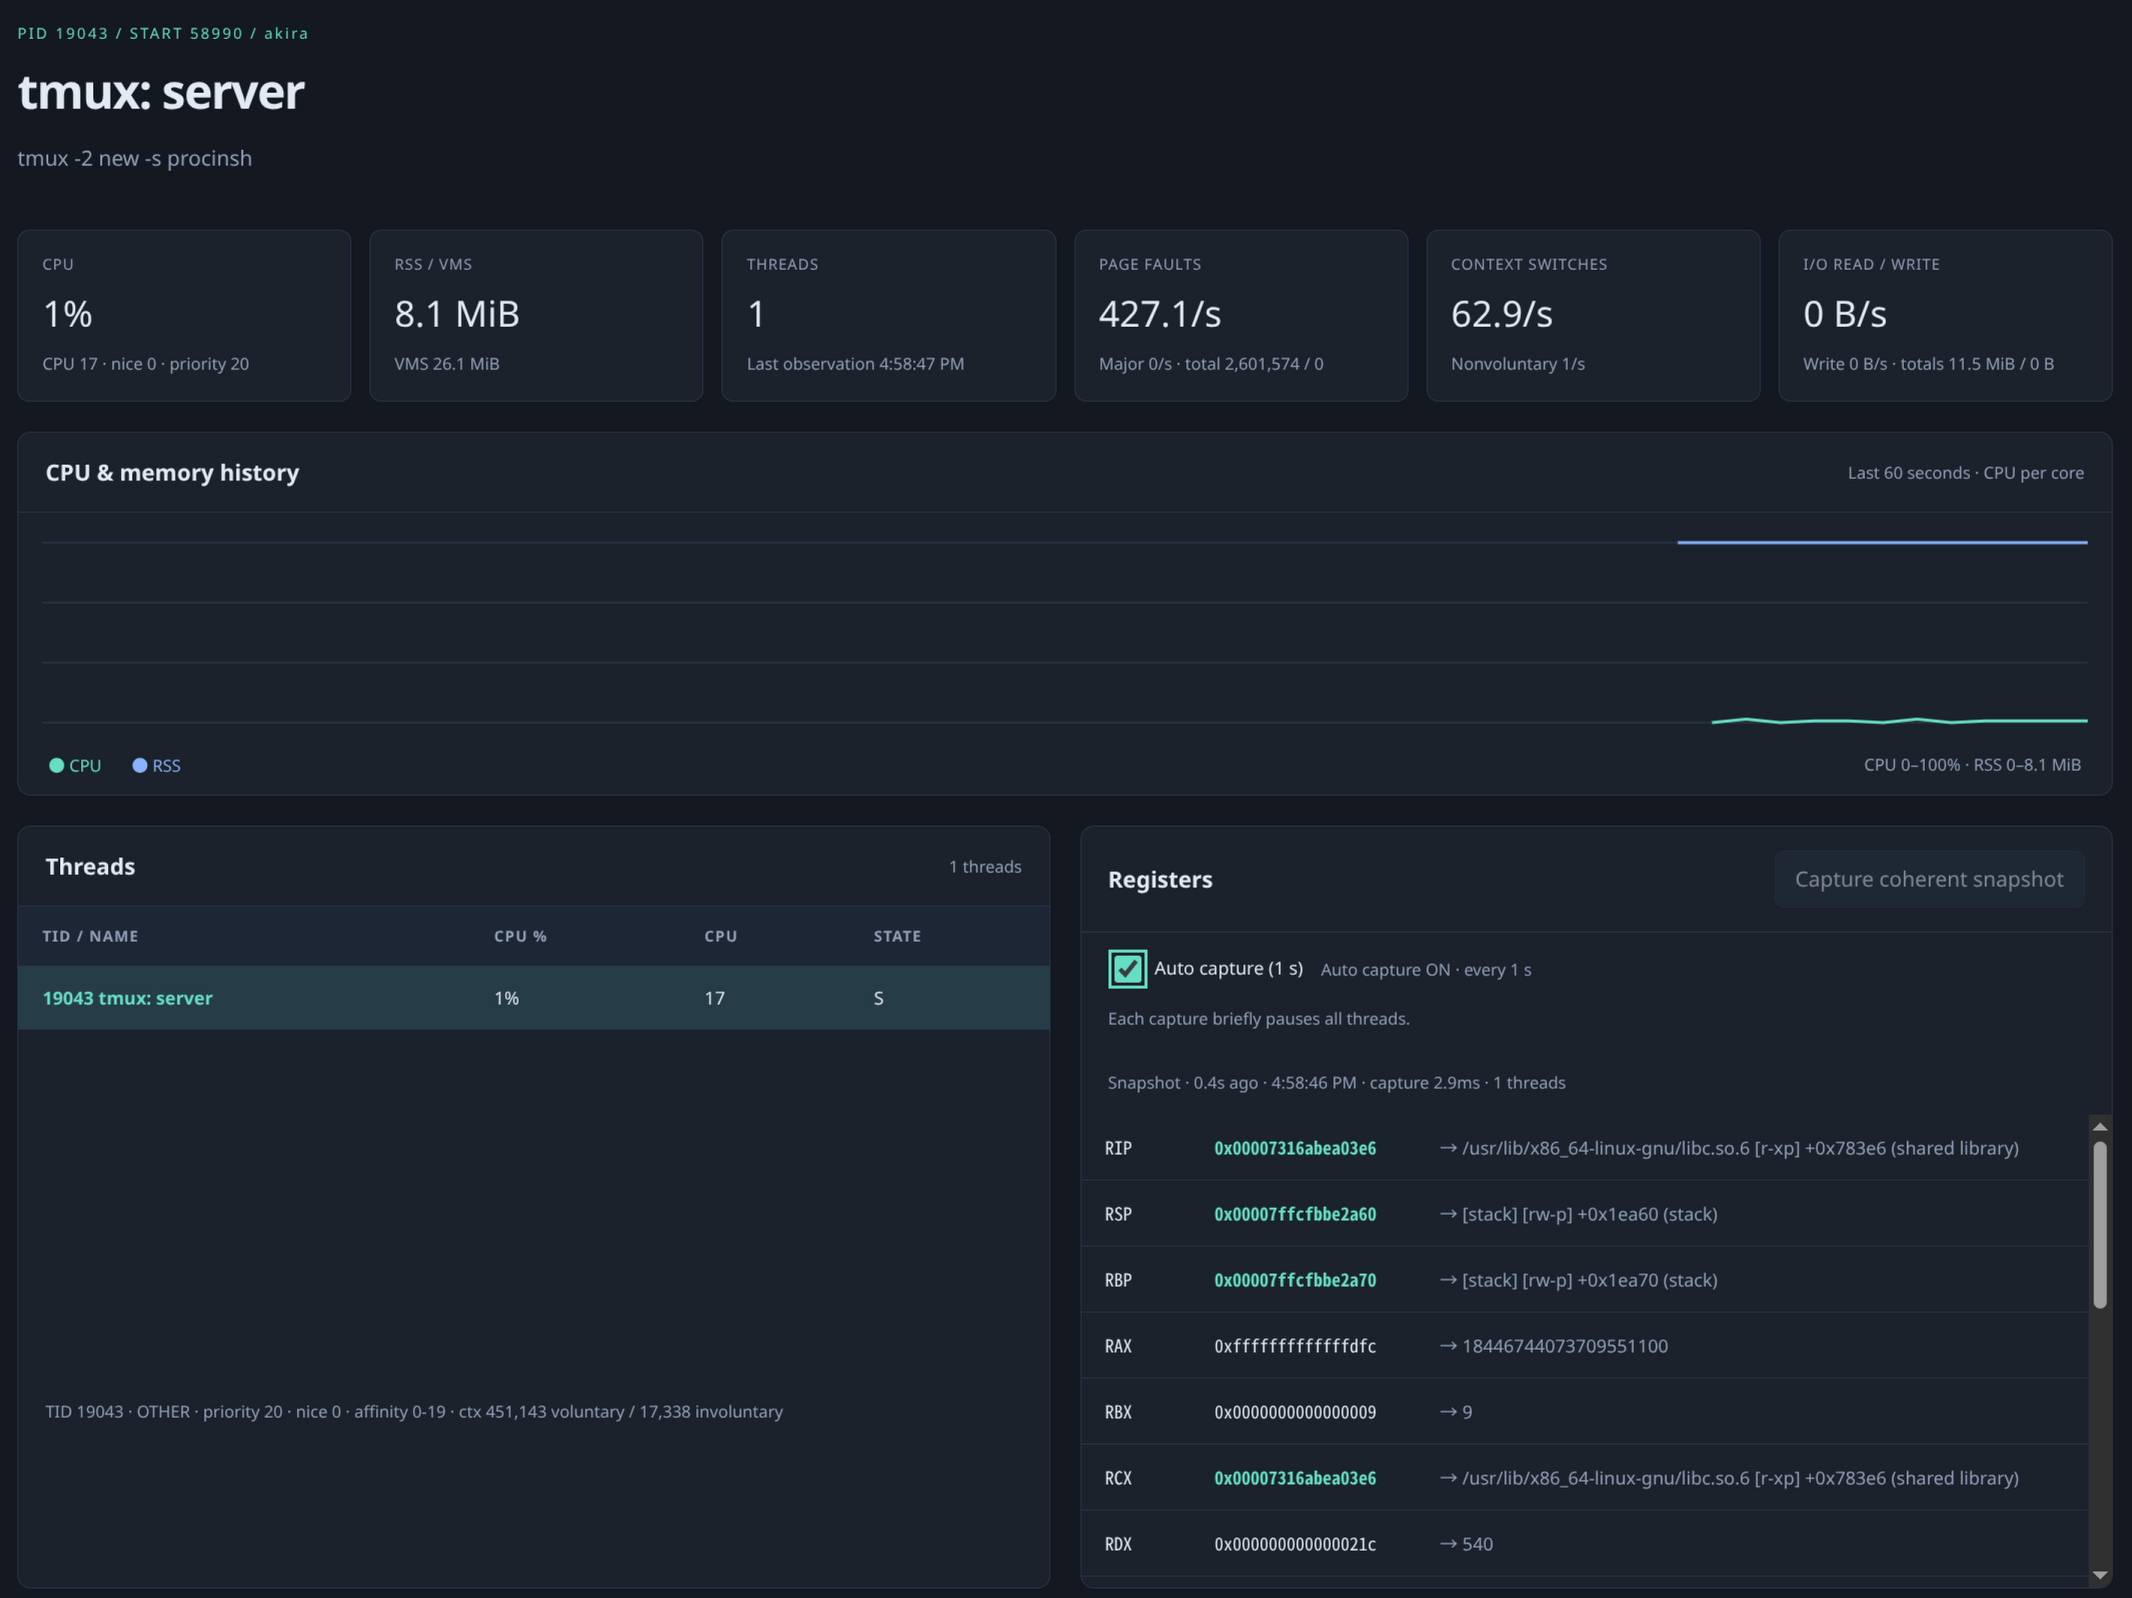
Clicking the “Open process details” link in the screen above opens the detail view for that process. This screen shows not only CPU and memory usage, but also information such as signal state. You can also inspect register values, the current call stack, and disassembly around the current execution point. I included these because they are things I sometimes want to inspect at work as well.
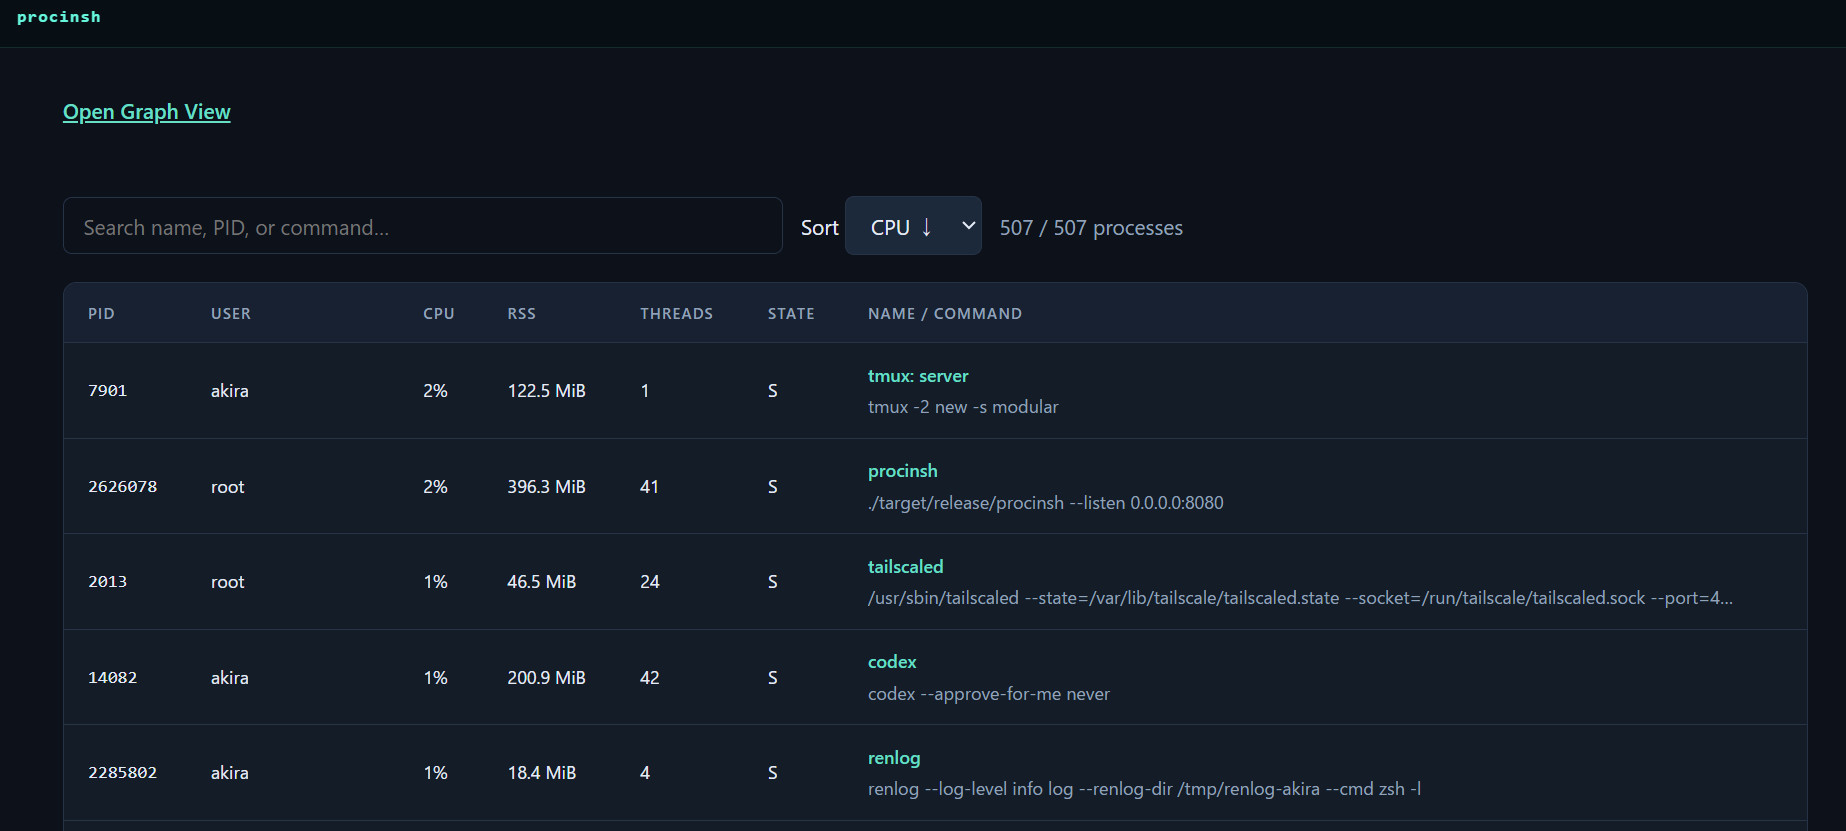
There is also a screen for listing processes, like a task manager. The 3D view is well suited to getting an overview of the whole system, but the list view is more convenient when you want to find a particular process.
Usage
You can install it with cargo.
However, because it uses eBPF, you need to install several packages before running cargo install.
I test it on Ubuntu 26.04 and Ubuntu 24.04.
On Ubuntu 26.04, you can install them with the following commands.
If you are using another distribution, please adapt the commands as appropriate.
On WSL2, follow Building on WSL2 (Ubuntu) to build procinsh.
It is not expected to work correctly in containers yet because of issues related to eBPF and PIDs.
Also, because procinsh uses features such as eBPF and ptrace that require elevated privileges, it must be run as root.
After starting it, open http://127.0.0.1:9090/ to see the process list, or http://127.0.0.1:9090/space to see the 3D view.
sudo apt-get install --yes --no-install-recommends \
         build-essential clang llvm pkg-config libelf-dev zlib1g-dev python3 \
         linux-tools-common linux-tools-generic
cargo install procinsh --locked
sudo "$HOME/.cargo/bin/procinsh" --listen 127.0.0.1:9090
If you prefer to run it without root privileges, set the appropriate capabilities. It can also run without capabilities you do not want to grant, though this limits the data it can observe.
sudo setcap \
  cap_sys_ptrace,cap_bpf,cap_perfmon,cap_dac_read_search=ep \
  "$HOME/.cargo/bin/procinsh"
"$HOME/.cargo/bin/procinsh" --listen 127.0.0.1:9090
Example Use
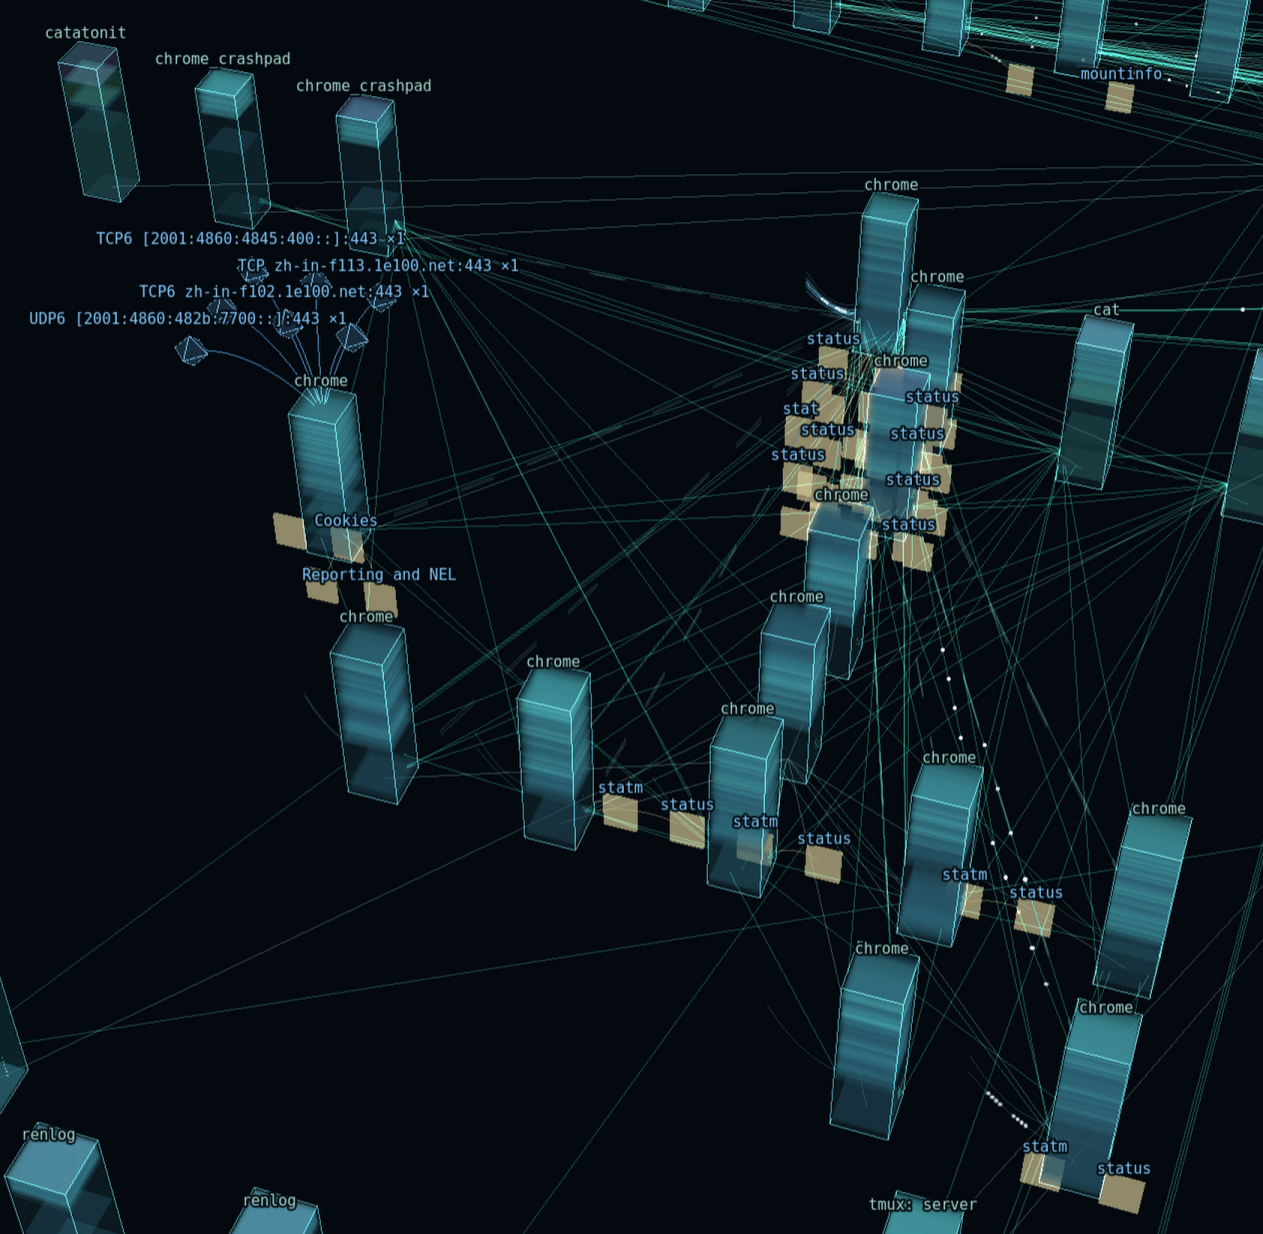
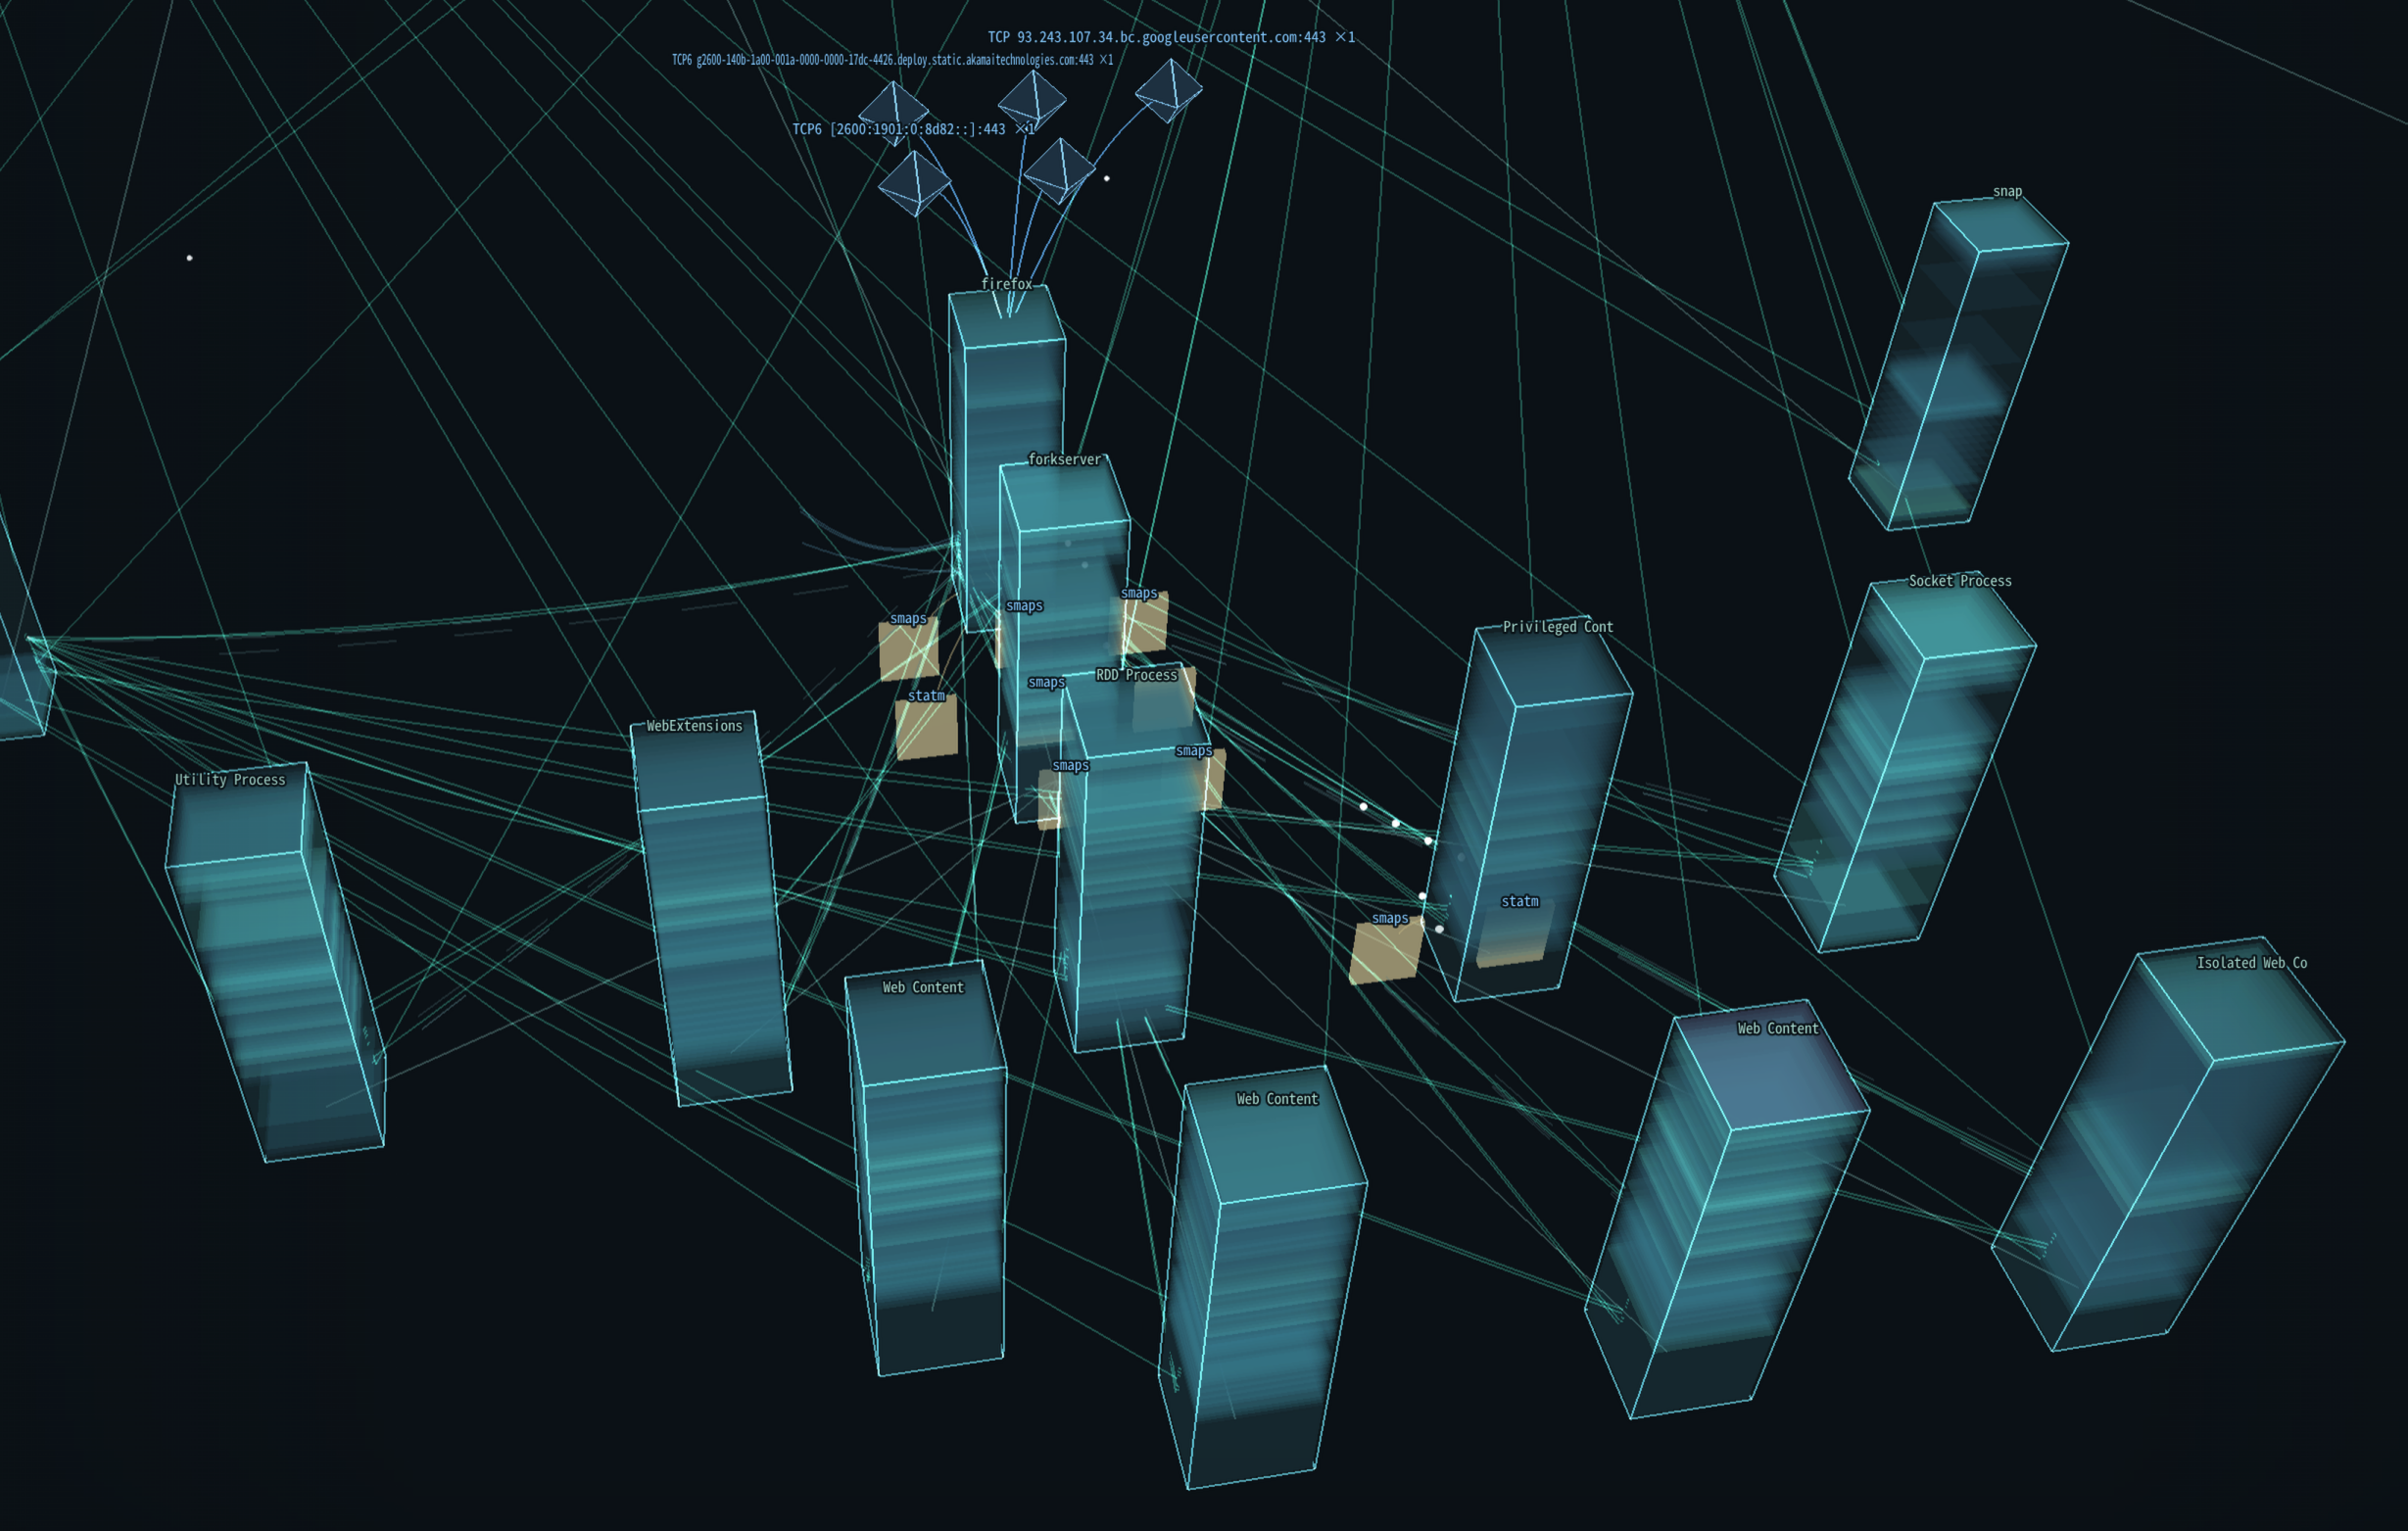
Simply starting procinsh and watching processes at work is fun, but you can also use it to observe differences in how web browsers behave when opening the same page. The two images below compare Google Chrome and Firefox when opening https://www.wikipedia.org/. Google Chrome is shown first, followed by Firefox. In Google Chrome, the process handling network communication is separate from what appears to be the main process, while in Firefox, what appears to be the main process also handles network communication.
How It Works
procinsh consists of a web frontend written in TypeScript and a backend server written in Rust.
The frontend uses Three.js to visualize information sent from the backend server.
I will not cover the frontend side in this article.
The backend server collects information about processes running on Linux in three different ways and sends it to the frontend.
procfs
Basic information about each process is obtained from Linux’s /proc filesystem (procfs).
For example:
- basic process information
- open file descriptors
- environment variables
- signal state
- memory maps
and so on.
ptrace / perf_event_open / process_vm_readv
Register values are obtained using both ptrace and perf_event_open.
When reading the contents of a process’s memory, procinsh uses process_vm_readv.
These make it possible to obtain lower-level information about a particular process.
eBPF
On the other hand, some information is collected as system-wide events without specifying a particular process in advance.
For example:
- processes running on the CPU
- communication through sockets and similar mechanisms
- file I/O
These events are collected using eBPF and sent from the backend to the frontend.
By combining the “current state” obtained from procfs and ptrace with the “events happening right now” obtained through eBPF, procinsh reflects what is happening inside Linux in a 3D space in real time.
Conclusion
I built procinsh, which lets you look inside Linux in a way inspired by Ghost in the Shell. Let’s look inside Linux and enjoy life in cyberspace.